
Financial Development, Technology Adoption, and Sectoral Productivity Convergence
Recommended citation: Avoumatsodo, Komla (2022). “Financial Development, Technology Adoption, and Sectoral Productivity Convergence”, Working Paper.
Download the paper from this link
I. Motivation
• Across countries, intensity of use of adopted technologies is positively correlated with financial development only for low financially developed countries.
Figure I plots the average log of the total technologies per capita adopted per capita acros countries from 1980 to 2003 against the average level of financial development
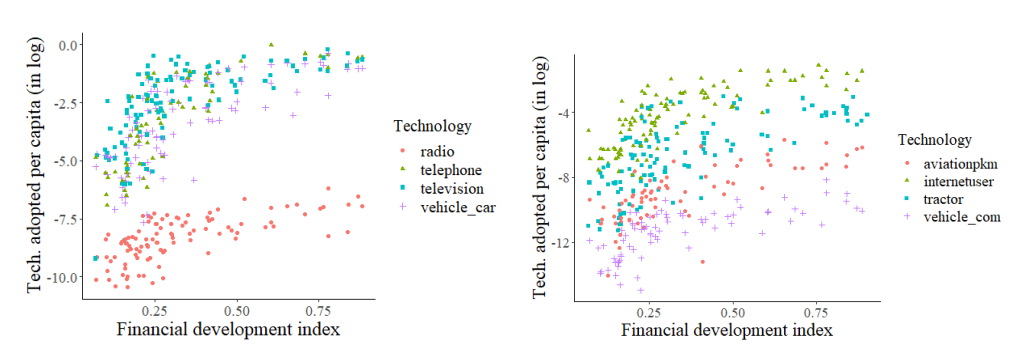
FIGURE I: Average levels of financial development and log technology adoption per capita, 1980-2003.
• Sectoral proximity (in productivity) to the frontier is positively associated with more use of adopted technologies across countries
Figure II displays scatter plots illustrating the association between the level of technology adoption and the sectoral proximity to the United States
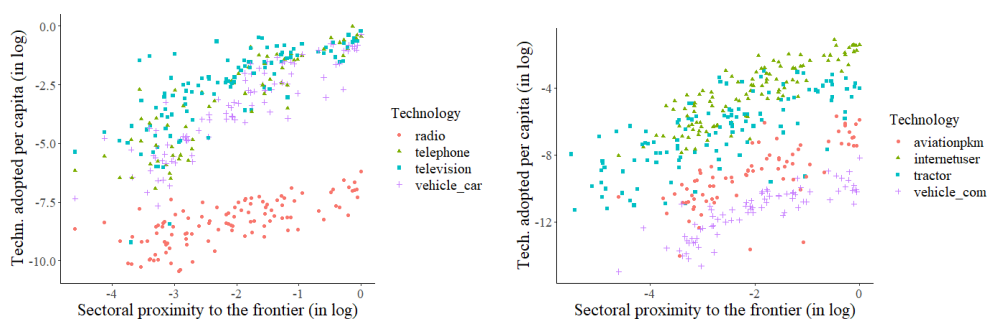
FIGURE II: Average levels of sectoral productivity proximity to the US and log intensity of use of technologies, 1991-2003.
• What does this paper do?
I construct a multisector growth model that features the above empirical facts observed in the data and show how financial development and aggregate productivity determine convergence or divergence of countries at sector level.
II. Model predictions
• Finance and intensity of use of adopted technologies
Figure III below illustrates the intensity of technology use $\theta_{jt+1}$ of sector $j$ at time $t+1$ as a function of sectoral proximity to the frontier $a_{jt}$ at time $t$ in sector $j$. It indicates that as financial development increases, so too does the intensity of use of adopted technologies. However, this effect diminishes beyond a certain threshold of sectoral proximity to the frontier or level of financial development.
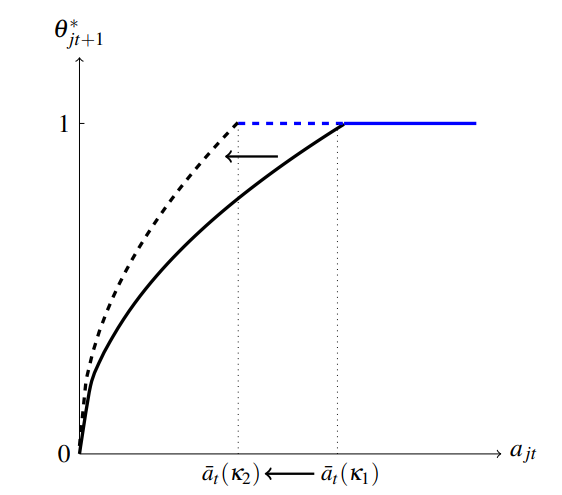
FIGURE III: Effect of financial development on the intensity of using new technologies: $\kappa_1<\kappa_2$.
• Finance, Aggregate Productivity and Sectoral Convergence
Figure IV provides a representation of the distribution of countries based on their levels of financial institutions $\kappa$ and aggregate productivity $A_t$. The three distinct groups of countries, characterized by their convergence or divergence patterns, are clearly delineated in the figure. It serves as a visual reference to better understand the relationships between financial development, aggregate productivity, and the classification of countries into these distinct categories.
FIGURE IV: Transitions of countries across financial development and aggregate productivity groups